Mathematical transformation
For this project our main goal was to find a linear and a non-linear relationship in a real world transformation. Some essential questions we had to answer were, How can real-world transformations be expressed as functions? How do linear and non-linear functions differ? and How can a mathematical function be transformed into beautiful work? The linear transformation I investigated was the number of iPhone sales throughout the years. The non-linear transformation I investigated was the length of a pencil after you sharpened it for different amounts of time. We chose these two transformation because they were the first most interesting ideas that popped into our minds. Like all of our other math projects we had Benchmarks for this project as well.
|
1. Length of pencil before and after sharpening. (The "in" is the amount of time the pencil was in the sharpener. The "out" is the length of the pencil before - the length of the pencil after). 2. Distance cannonball is shot depending on how much gunpowder is used. ( The "in" is the amount of gunpowder in the cannon. The "out" is the distance the cannon was shot). 3. The splash a ball creates when dropped at various heights. ( The "in" is the height that the ball is dropped at. The "out" is the circumference of the of splash or ripples that it caused) 4. Dropping an egg from different heights to see how large the splat is. ( The "in" is the height of the egg dropped. The "out" is the area of the splat.
Benchmark #3
|
Benchmark #1
|
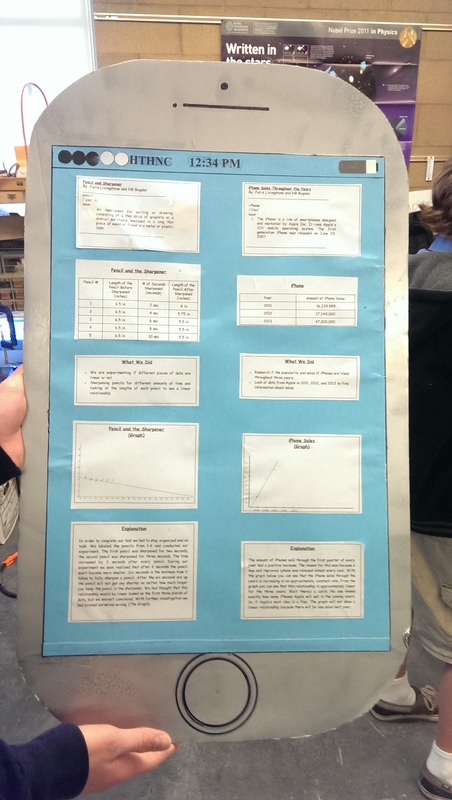
Our first benchmark was to come up with 4 different transformations in the real world. After this we would then pick two transformations to study further. For the 2nd Benchmark we had to create a short document that contains an explanation of how you obtained your data, In-Out tables (one linear, one non-linear), Evidence that your linear relationship is actually linear (or approximately linear) and graphs of your linear and non-linear relationship. This is a picture of our final product (Benchmark #3). We wanted to try and incorporate all of the info from both transformations on one surface and the best way to do that was to use the display of an iPhone which fit in perfectly with the transformation. All of the data was placed as if it would be on a phone's notepad or something similar to that. | ||
Now to go more towards the work part of everything here are the two In and Out Tables and the two Graphs.
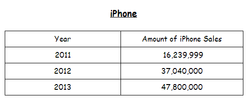
This is the table for our Linear Relationship (and the graph is below). The linear transformation was the number of iPhone sales throughout the years. Below you can see that this transformation is actually approximately linear. There is also a catch if the iPhone sales decreased then this transformation would become non - linear.
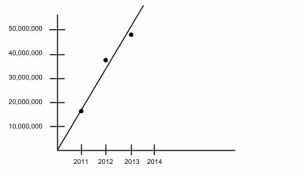
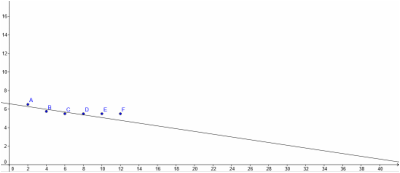
This is the graph for the iPhone sales
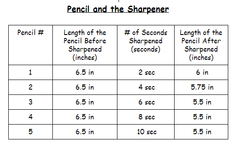
This is an image of our non-linear relationship (with the graph below). The non-linear relationship was the length of a pencil after sharpening it for different amounts of time. This transformation started off linear but then with further investigation we realized that after 6 seconds you can not sharpen the pencil anymore. The length of the pencil will mostly stay the same length.
This project was a success for my partner and I. We accomplished most of our goals on time and always dodged obstacles. The only small problem I had was that I felt that we didn't spread the work out too evenly. I usually don't have a problem with this partner for anything but this time I feel I had a way bigger role. To change my project I would have liked to connect my transformations to our exhibition project for Humanities and Physics. The math portion of exhibition was a little bit lost and no one really talked about it too much. The habit of a Mathematician that I used really well and always am good at is to stay organized. I think I stayed organized by spreading the work out among myself. Doing things one at a time really helped me in this project and will probably also help me in my future career and work.
