Power, Privilege, and Purse
Introduction
For the "Power, Privilege and the Purse" project we discussed and researched about different inequalities that occur in our country. We learned about many different kinds of inequalities and how these inequalities date far back but are still present everywhere. Our connecting point for all these topics was the American Dream. We looked into our selected inequality and figured out its affect on the American Dream. As our Humanities teacher Dr. Cochran says "The American Dream, which has symbolized our nation, is rooted in the ideals set forth in the Declaration of Independence-- ALL men are created equal. However, we live in a society that often defines us by what makes us different. Race, class, and gender have played a significant role in shaping the path of our nation’s history." Some of our other topics included women's rights, educational inequalities, wage issues throughout the country and also immigration. This project integrated both the subjects of math and humanities which made the project seem a lot more real and connected to the world. We also held a final exhibition that was a symposium themed exhibition bringing awareness to the topic of our choice, which is talked about more below. In our Humanities class, we did most of the research, created our symposium sessions and wrote position papers taking a stance on our assigned topic (our topics were chosen based on our personal interest). In our Math class, we spent more time looking into the numbers behind these issues, and covered topics like statistics, looking at data of different inequalities and other topics.
Math
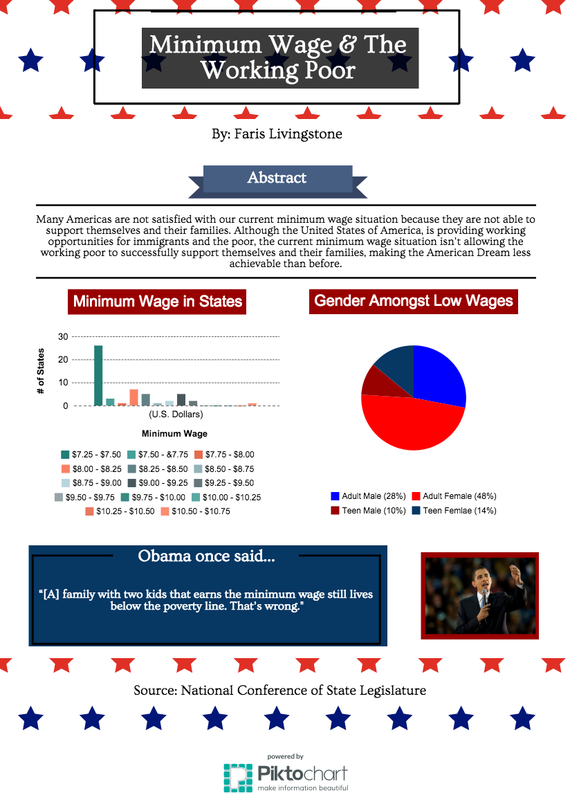
Starting off with math first. Before we formally started this project it was important to see how much we really knew about the future, specifically how would we take care of ourselves in the future (mainly regarding money). In these initial stages we learned about budgeting, saving, investing and also financial responsibilities. We created tables and spreadsheets showing how much money we would make yearly (from a previously chosen job) and where that money would be spent monthly, including taxes, savings and investments. From this financial responsibilities section I learned a lot of being financially responsible. Investing money helps if you are willing to take risks, making a lot of money for some can't always mean easy life due to taxes and other things, budgeting is an important skill because it allows you to be smart with your money and not waste it but most importantly, it's not always going to be easy. To help me make my decisions I used graphs and spreadsheets to mathematically model how much money I would save and gain by investing and how I can budget successfully. I also used these graphs to learn about exponential growth and decay in the real world, when you invest in something and the price of it goes up and down depending on such and such factors. Learning about growth and decay allowed me also to learn about compounded interest, when interest basically adds on to an existing interest at an exponential rate. Throughout the process of this project we did take time to learn about other topics, one of which for us was logarithms. What I understood from logarithms was that they are used as the inverse of exponents, to basically find the exponential value in an equation. Logarithms were mainly helpful to figure out time periods and how long it would take for money to reach a certain number or value given the initial value. To collect and combine all these topics we finally learned about different graphs so that we could use what we had learned to make our own infographics (below). This entire math semester has allowed me to see how our economy really works and how many problems we actually face in our country. Some of the number on graphs can be very shocking and eye-opening. I was also glad we did some future planning through budgeting and career planning because I am not too far away from that stage and it is something I need to possible think about. My infographic below is based on statistics from minimum wage workers and different wages in states.
Humanities
For the "Power, Privilege and the Purse" project we discussed and researched about different inequalities that occur in our country. We learned about many different kinds of inequalities and how these inequalities date far back but are still present everywhere. Our connecting point for all these topics was the American Dream. We looked into our selected inequality and figured out its affect on the American Dream. As our Humanities teacher Dr. Cochran says "The American Dream, which has symbolized our nation, is rooted in the ideals set forth in the Declaration of Independence-- ALL men are created equal. However, we live in a society that often defines us by what makes us different. Race, class, and gender have played a significant role in shaping the path of our nation’s history." Some of our other topics included women's rights, educational inequalities, wage issues throughout the country and also immigration. This project integrated both the subjects of math and humanities which made the project seem a lot more real and connected to the world. We also held a final exhibition that was a symposium themed exhibition bringing awareness to the topic of our choice, which is talked about more below. In our Humanities class, we did most of the research, created our symposium sessions and wrote position papers taking a stance on our assigned topic (our topics were chosen based on our personal interest). In our Math class, we spent more time looking into the numbers behind these issues, and covered topics like statistics, looking at data of different inequalities and other topics.
Math
Starting off with math first. Before we formally started this project it was important to see how much we really knew about the future, specifically how would we take care of ourselves in the future (mainly regarding money). In these initial stages we learned about budgeting, saving, investing and also financial responsibilities. We created tables and spreadsheets showing how much money we would make yearly (from a previously chosen job) and where that money would be spent monthly, including taxes, savings and investments. From this financial responsibilities section I learned a lot of being financially responsible. Investing money helps if you are willing to take risks, making a lot of money for some can't always mean easy life due to taxes and other things, budgeting is an important skill because it allows you to be smart with your money and not waste it but most importantly, it's not always going to be easy. To help me make my decisions I used graphs and spreadsheets to mathematically model how much money I would save and gain by investing and how I can budget successfully. I also used these graphs to learn about exponential growth and decay in the real world, when you invest in something and the price of it goes up and down depending on such and such factors. Learning about growth and decay allowed me also to learn about compounded interest, when interest basically adds on to an existing interest at an exponential rate. Throughout the process of this project we did take time to learn about other topics, one of which for us was logarithms. What I understood from logarithms was that they are used as the inverse of exponents, to basically find the exponential value in an equation. Logarithms were mainly helpful to figure out time periods and how long it would take for money to reach a certain number or value given the initial value. To collect and combine all these topics we finally learned about different graphs so that we could use what we had learned to make our own infographics (below). This entire math semester has allowed me to see how our economy really works and how many problems we actually face in our country. Some of the number on graphs can be very shocking and eye-opening. I was also glad we did some future planning through budgeting and career planning because I am not too far away from that stage and it is something I need to possible think about. My infographic below is based on statistics from minimum wage workers and different wages in states.
Humanities
Pictures
|
|
|
